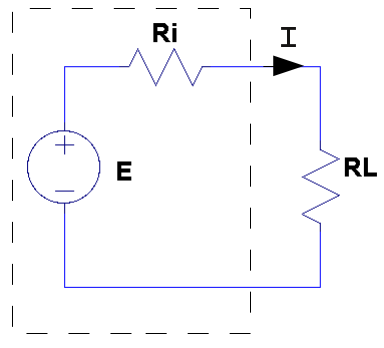
| Figure 1: | |
 |
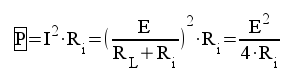
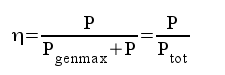
1.1 |
 |
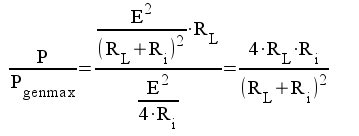
1.2 |
 |
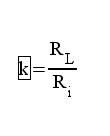
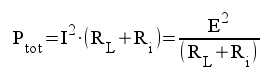
1.3 |
 |
and set |
 |
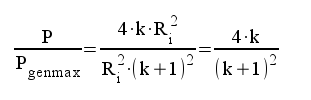
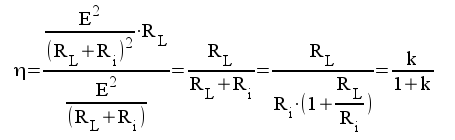
1.4 |
 |
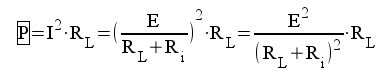
1.5 |
 |
Maximum
power is |
 |
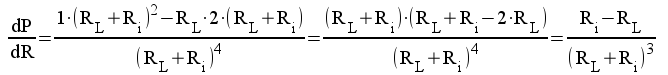
1.6 |
 |
1.7 |
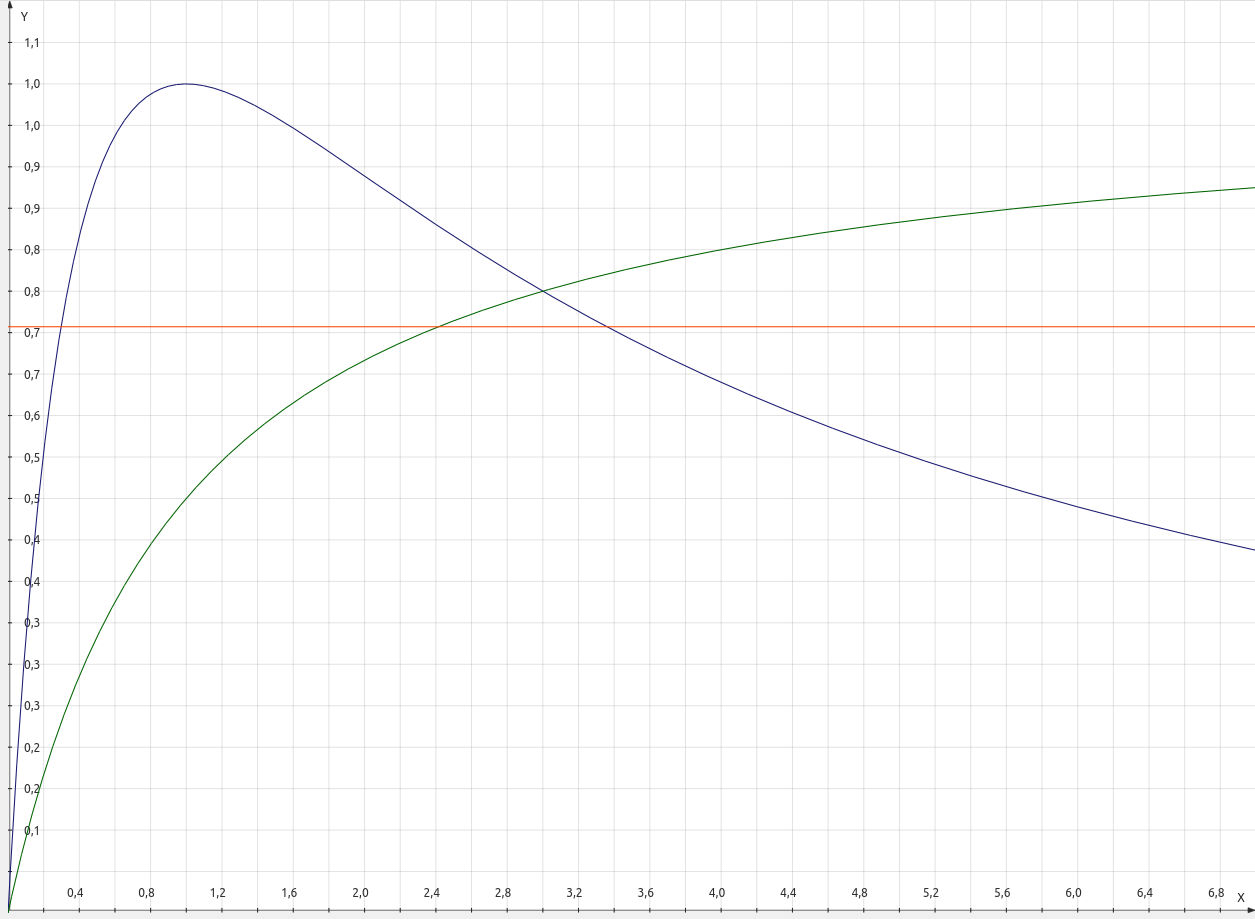
| Blue |
curve shows kvote between power in RL
and maximum available generator power |
| Green |
curve corresponds to the circuits efficiency |
| Red |
line shows when the
power has reached |